Chart Customization
Objective: Learn how to customize a chart in a report
-
Go to the chart area
-
Right click anywhere on the chart
-
A box will appear with a range of options to select
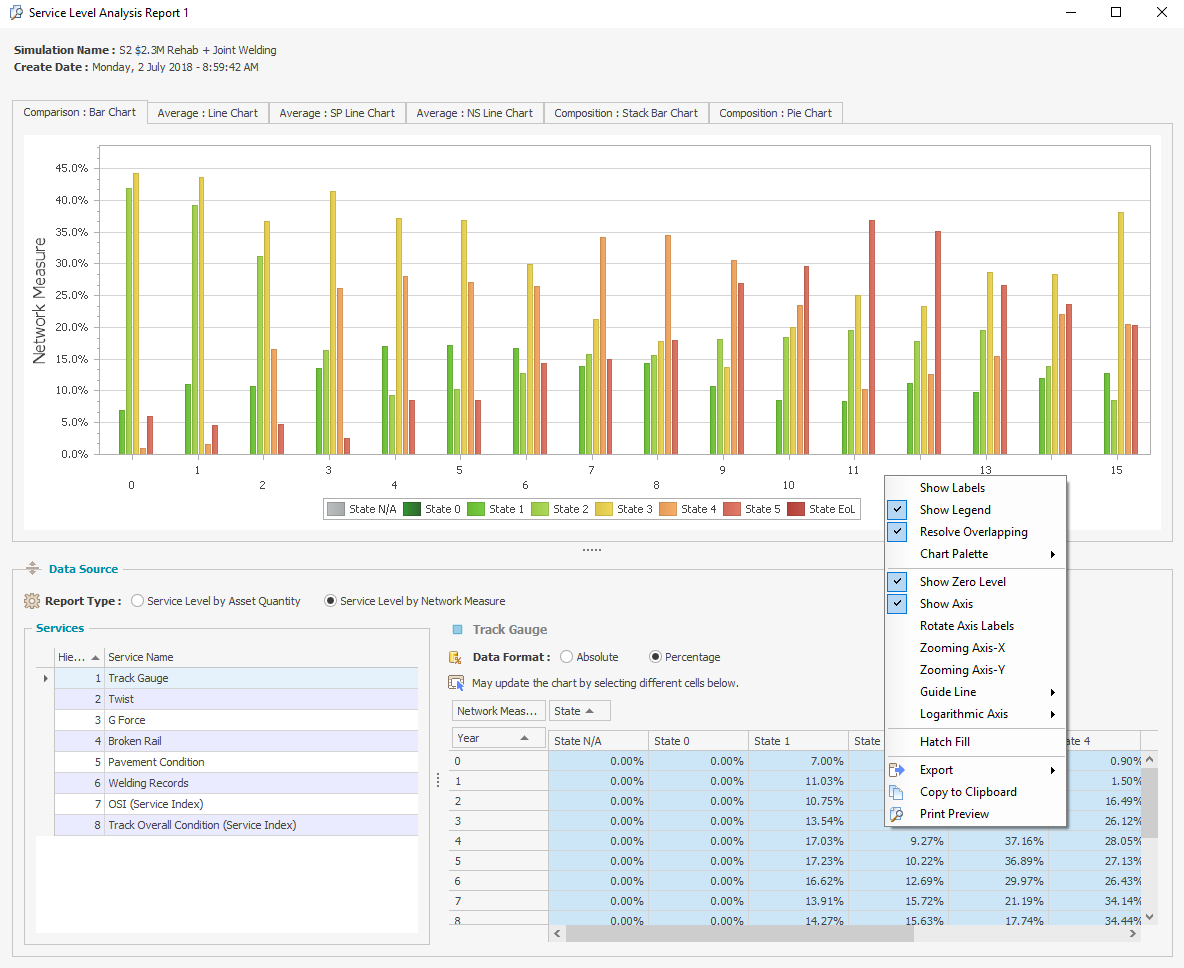
By unchecking the Show Labels and Show Legend boxes, for example, the labels and legend will disappear. To show the Labels or Legend again, click in the corresponding checkbox.
